This feature enables a monitoring interface for administrators, that displays the most important information and parameters from Carbonio CE.
To access the feature, select Server from the main menu, then click the Misc tab.


Scroll down until you reach the module.
On the main screen, you will see the button to activate the module. Just click Enable

| ⚠ Warning! When you enable Monitor for the first time, the Proxy service needs to be restarted. Depending on the load and resources, this process might take a few seconds. |
The Status notice will comfirm that the module is Enabled and and then you can log in to the interface by clicking or copying the URL and entering the login credentials requested next.
| ⚠ Warning! It’s highly recommended to change the password once logged into Grafana for security reasons. |
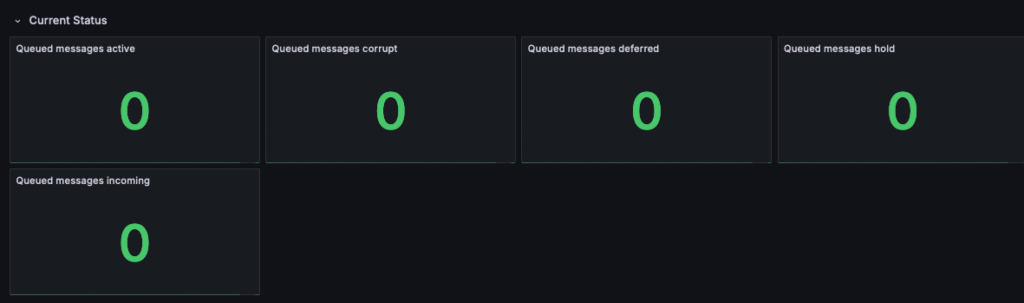
Once your are in, you will be taken to the Current Status view and by deafult the mail queues are shown.
The dashboards includes a series of other important informations for admins, including: Basic CPU / Memory / Net / Disk; Database status; PostgreSQL; Carbonio CE processes; Service status; etc.
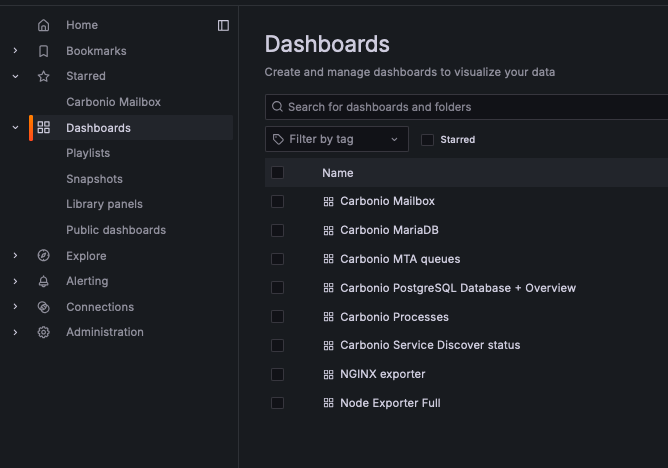
To change your dashboard and view, you can do so from the left menu by selecting Dashboards and then pickiing up the option you want to see.